
The stats.ComputeStats class
The stats module contains a set of tools to analyze molecular
variation data, either represented as Align instances (which
have been extensively described in the previous part of the manual) or
Site instances (which hold information for a single locus).
Among those tools, stats.ComputeStats is the more complex,
and the more rich with functionalities. Most of the statistics can be
computed using this class (in general, only the most complex statistics
deserve their own function or class, such as part of linkage
disequilibrium statistics, which are addressed near the end of this
page).
The rationale for defining ComputeStats as a class rather than a
standalone function is that it allows more flexibility (the following
sections offer an overview of the possibilities) and that it can also be
more efficient if a lot of items (alignments or sites) need to be processed
in a row.
The basic worflow consists in the following steps, which are developped in the following paragraphs:
Create an instance of the class,
Set parameters,
Enter the list of statistics to be computed,
Process one or several alignments or sites.
Options
It is possible to pass parameters values either as arguments of
stats.ComputeStats instances, or through their
configure() method. The parameters are listed and
explained in the documentation of this method. The most important is
multi_hits. By default, multi_hits is False, causing all sites
that have more than two alleles to be excluded as well. The default
parameters might be what you want if you use single-nucleotide
polymorphism markers or nucleotide sequence alignments, but certainly
not if you use massively multiallelic markers.
To pass parameters, both syntaxes are equivalent:
>>> cs = egglib.stats.ComputeStats()
>>> cs.configure(multi_hits=True)
and
>>> cs = egglib.stats.ComputeStats(multi_hits=True)
Note also that it is also possible to call configure() later at
any moment in the workflow. In general, it is recommended to reuse as
much as possible objects whenever you perform intensive computations.
List of statistics
Statistics can be specified using the instance method add_stats().
It is possible to call this method several times in a row, it can be
called at any time even after analysing data sets, and it is also possible
to enter several statistics at once, as shown in the example below:
>>> cs.add_stats('S', 'Pi')
>>> cs.add_stats('D')
Statistics are represented by a code (as a str). A list of
tuples matching each code with a short description can be obtained through
the instance method list_stats(). A exhaustive notice
is available in Diversity statistics.
>>> for stat, descr in cs.list_stats():
...     print(stat + ': ' + descr)
ns_site: Number of analyzed samples per site
ns_site_o: Number of analyzed outgroup samples per site
Aing: Number of alleles in ingroup
Aotg: Number of alleles in outgroup
Atot: Number of alleles in whole dataset
As: Number of singleton alleles
Asd: Number of singleton alleles (derived)
R: Allelic richness
thetaIAM: Theta estimator based on He & IAM model
thetaSMM: Theta estimator based on He & SMM model
[...skipped...]
If is possible to activate at once all statistics belonging to one of the tables of statistics available (Single site statistics, Unphased sites statistics, Phased sites statistics, and Allele size statistics) using the following syntax:
>>> cs.add_stats('+site')
Note
Even if a statistic can be computed, it does not mean that it should. When analysing data, it can be counter-productive to generate huge tables of statistics among which some (many) may have too much variance to be interpreted anyway.
You can reset the list of statistics using:
>>> cs.clear_stats()
If you are happy with default values of parameters, you are not
required to call configure(). However, it is
necessary that you enter parameters to be computed, so you have to call
add_stats(). Still, it is not an error to
skip this step and proceed with analysing data (but in that case you
will not get any results).
Processing data
Once needed parameters have been set and needed statistics have been
entered, the user can analyze data using the following methods of
the ComputeStats instance:
process_align()to process anAligninstance.
process_site()to process aSiteinstance.
process_sites()to process severalSiteinstances.
process_freq()to process aFreqinstance (see below).
These methods are addressed in more details in the following section.
By default, they all return a dict containing computed values
of statistics corresponding to the analysis of data provided as argument.
It is also possible to call them several times and access the results of
the analysis of all passed data eventually (see Multiple alignments).
Computing statistics
Single alignment
Computing statistics from a single alignment should be rather straightforward. Assume we have a Fasta file containing a nucleotide alignment. We show below how we would compute a set of standard statistics used in the case of nucleotide sequences from this alignment:
>>> aln1 = egglib.io.from_fasta('align1.fas', labels=True, alphabet = egglib.alphabets.DNA)
>>> struct = egglib.struct_from_labels(aln1, lvl_pop=0, lvl_indiv=1)
>>> cs = egglib.stats.ComputeStats()
>>> cs.set_structure(struct)
>>> cs.add_stats('S', 'thetaW', 'Pi', 'D', 'lseff', 'nseff')
>>> stats = cs.process_align(aln1)
>>> print(aln1.ns, aln1.ls)
101 8942
>>> print(stats)
{'lseff': 3288, 'S': 305, 'thetaW': 59.02529109000289, 'nseff': 99.0, 'Pi': 67.56256441970726, 'D': 0.48870487478046226}
Note that in order to exclude the outgroup sequences from the analysis,
we have to import labels and generate an appropriate Structure
instance using the method struct_from_labels(). The management of
structures is described in the next section. This structure is then imported
in the ComputeStats instance using the method set_structure().
As visible in the statistics list, the number of available statistics is
much larger than that, but many will be irrelevant for this kind of data
(most of them being reported as None because they just can’t be computed).
We first printed the ns (number of provided samples) and
ls (alignment length) properties of the alignment: there are 101
samples and 8942 sites.
Sis the number of polymorphic sites. Here we have 305 variable sites.
thetaW(\(\hat{\theta}_W\)) is the so-called Watterson’s estimator of \(\theta = 4N_e\mu\). The value is close to 60 which approaches 0.09 per analysed site (see below).
Pi(\(\pi\)) is the nucleotide diversity, which is a bit larger.
D(Tajima’s \(D\)) is positive (+0.49), which is a corollary ofPibeing larger thanthetaW.
lseffis the number of sites used for analysis (excluding those with either too many missing data or too many alleles). Here the number is 3288, meaning that 5654 sites have been excluded (mostly because the default is to exclude all sites with any missing data).
nseffis the average number of used samples among included sites. In our case, since only sites with no missing data at all have been used, the number of samples is 99 because the last two sequences are from the outgroup, but this value can be smaller if the parameter max_missing is larger than 0 (see example in Missing data).
Note
thetaW and Pi are given per gene (that is, they are
summed over the total number of analyzed sites). To be expressed
per site, they must be divided by the number of sites available for
analysis. If all sites have been provided, this value is given by
the statistic lseff. But lseff is relevant if only
polymorphic or pre-filtered sites have been provided.
Multiple alignments
If you have several separate alignments but you want to obtain global
statistics, the instinctive approach would be to concatenate the alignments
and use the result in process_align(). There is a much more efficient
way (assuming you want to do so with many alignments), described below.
There is a multi option which, if toggled, set ComputeStats
to load data in several batches, perform intermediate computations but
delay finalisation of statistics computations until all data have been
loaded. In that case, you must call results() to
actually compute and get statistics:
>>> alnA = aln1.extract(0, 4500)
>>> alnB = aln1.extract(4500, None)
>>> cs.configure(multi=True, struct=struct)
>>> cs.process_align(alnA)
>>> cs.process_align(alnB)
>>> stats = cs.results()
>>> print(stats)
{'thetaW': 59.02529109000289, 'D': 0.48870487478046226, 'nseff': 99.0, 'lseff': 3288, 'Pi': 67.56256441970726, 'S': 305}
The above example just cut the original alignment in two parts, and then
processes the two alignments separately. The final dictionary of statistics,
as expected, is exactly identical to the one obtained with the full
alignment (n.b. even if it was specified before, it is necessary to pass
again the structure, because the call to configure() resets all
parameters that are not specified).
Phased data
Note that some statistics require that data are phased. That’s the case of all statistics based on haplotype and linkage disequilibrium. If multiple alignments are loaded, it is not ensured that data are phased, even if the number of samples matches. Make sure that your data are REALLY phased if you want to compute these statistics. By default EggLib will calculate them if the data allow it. Note also that all statistics requiring phase entail significantly longer computations when applied to large number of polymorphic sites. These stastistics are also hardly relevant over large genomic regions.
Using individuals sites
Individual sites can be processed as well. They are represented by the
class Site. This class is aimed to represent data for any
genetic marker such as a single nucleotide polymorphism (SNP), a
microsatellite, an encoded insertion/deletion polymorphism, or any other
form of genetic variation properly encoded using an appropriate Alphabet instance.
The following functions allow to create a Site:
Generator functions |
Source of data |
|---|---|
A position in an |
|
A user-provided |
|
The current data of a VCF parser (see Using VCF files). |
Note that each of those functions has a counterpart as a Site
method to allow to recycle an existing object.
In the examples of the following paragraphs, we will create sites from
the same alignment that we have been using in previous examples. However,
in practice the class Site is mostly there for cases when
individual sites are available. The small example below shows how to
create a Site from a list of allelic values, which is the most
simple and intuitive way:
>>> site = egglib.site_from_list(
...     ['C', 'G', 'G', 'C', 'T', 'T', 'G', 'T', 'G', 'G', 'G', 'G'],
...     alphabet=egglib.alphabets.DNA)
Note
When analysing individual sites, it is frequent that more than two
alleles are present (except for canonical SNP sites). It can also
happen with sequence alignments. If this is the case and you wish to
include such sites in the analysis, don’t forget to set the
ComputeStats parameter multi_hits to True.
Single site statistics
The code in the next example will clear the list of statistics and specify a list more adapted to single-site analysis, and then will analyse the site at position 66 (which is the 67th site):
>>> cs.clear_stats()
>>> cs.configure(multi=False, struct=struct)
>>> cs.add_stats('Aing', 'He', 'R')
>>> site = egglib.site_from_align(aln1, 66)
>>> stats = cs.process_site(site)
>>> print(stats)
{'Aing': 3, 'R': 0.02040816326530612, 'He': 0.6233766233766234}
The statistics computed here are:
Aing: the number of alleles in ingroup (this is a relatively unfrequent case with a SNP with three alleles within a nucleotide alignment).
R: the allelic richness.
He: the heterozygosity (which is above 0.5 only because there are three alleles).
Multiple sites statistics
You might be also interested in statistics over several sites. You can
load multiple sites in a similar way as for alignments. In the example
below we compute, in addition to Aing, R and He, the
per-gene statistic D over all sites of the alignment, but we keep
on computing statistics on a per-site basis:
>>> cs.add_stats('D', 'Pi')
>>> site = egglib.Site()
>>> for i in range(aln1.ls):
...     site.from_align(aln1,i)
...     stats = cs.process_site(site)
...     print(stats)
{'R': 0.0, 'He': 0.0, 'Pi': None, 'D': None, 'Aing': 1}
{'R': 0.0, 'He': 0.0, 'Pi': None, 'D': None, 'Aing': 1}
[...skipped...]
{'R': 0.010416666666666666, 'Pi': None, 'D': None, 'He': 0.3762886597938144, 'Aing': 2}
{'R': 0.01020408163265306, 'Pi': None, 'D': None, 'He': 0.37105751391465686, 'Aing': 2}
{'R': 0.010309278350515464, 'Pi': None, 'D': None, 'He': 0.3736587418472543, 'Aing': 2}
[...skipped...]
In this example, we recycled a unique Site instance using its
method from_align() instead of creating a new instance at
each iteration step, which is a good practice for performance reasons in
this precise sitution. Note that there is also a
process_sites() method to process a list of sites
in one call. process_sites() is more appropriate to process
dynamically generated arrays of sites as in this case.
Pi and D are not computed because they are not defined for
individual sites. What we really want, in this example, is to replicate
the analysis performed with process_align() to demonstrate how it
would be done if we had only individual sites in the first place. This
can be achieved by means of the multi argument:
>>> cs.configure(multi=False, struct=struct)
>>> for i in range(aln1.ls):
...     site.from_align(aln1,i)
...     stats = cs.process_site(site)
>>> print(cs.results())
{'He': 0.02184674638703229, 'Aing': 1.098813786929275, 'R': 0.0010210126233630454, 'Pi': 185.90085077948126, 'D': 0.47716739584524404}
Static list of sites
Linkage disequilibrium statistics, as well as \(\bar{r}_d\) (code
rD), require that all sites used for analysis are available at the
time of final computation. Those statistics cannot be computed by the
method results() of
ComputeStats if the data have been provided by
process_site() or process_sites(). The examples below
demonstrates it with the case of the ZnS statistic. Such statistic
can be computed if we pass an Align:
>>> cs.clear_stats()
>>> cs.add_stats('ZnS')
>>> print(cs.process_align(aln1))
{'ZnS': 0.17236275214525582}
They can be as well if we pass several fragments, but only if they have the same number of samples (it is implied that the list of samples is matching, that is that data are phased):
>>> alnA = aln1.extract(0, 4500)
>>> alnB = aln1.extract(4500, None)
>>> cs.configure(multi=True)
>>> cs.set_structure(struct)
>>> cs.process_align(alnA)
>>> cs.process_align(alnB)
>>> print(cs.results())
{'ZnS': 0.17236275214525582}
To test what happens when we provide the sites individually, we extract
all sites of the alignment. However, process_align()
excludes by default all sites with any missing data in the ingroup while
process_site() considers all sites which are provided. So we need
to filter the sites ourselves, to only include those that have no
missing data, hence 99 available samples, using the class Freq:
>>> sites = []
>>> frq = egglib.Freq()
>>> for i in range(aln1.ls):
...     site = egglib.site_from_align(aln1, i)
...     frq.from_site(site, struct)
...     if frq.nseff(frq.ingroup) == 99:
...         sites.append(site)
The statistics in question are not computed if we provide the sites individually and one by one, regardless of whether they are phased or not, because nothing guarantees that the site objects will be constant until statistics are actually computed:
>>> for site in sites:
...     cs.process_site(site)
>>> print(cs.results())
{'ZnS': None}
In that case, it is necessary to pass all sites grouped together in one list:
>>> print(cs.process_sites(sites))
{'ZnS': 0.17236275214525582}
Site frequency spectrum
A function is dedicated to computing the site frequency spectrum (SFS)
out of a set of sites. The sites can be provided as a list of
Site instances or any iterable yielding Site
instances such as those provided by Align.iter_sites() or
VCF.iter_sites().
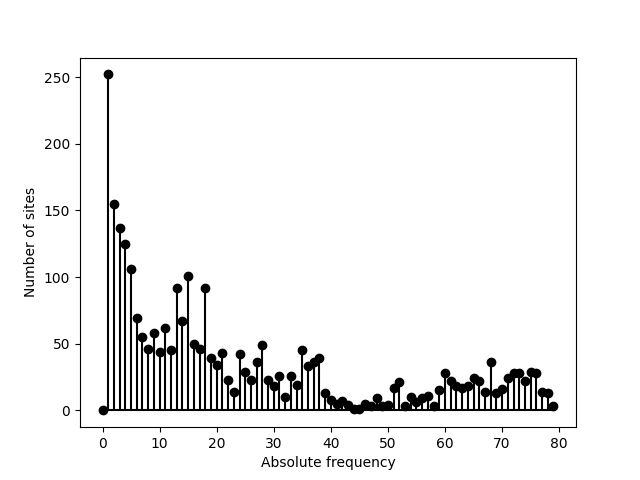
Below, we use the latter tool to screen a VCF file and compute the SFS using all sites:
>>> import egglib
>>> vcf = egglib.io.VCF('LG15.bcf')
>>> sfs = egglib.stats.SFS(vcf.iter_sites())
>>> print(sfs)
[0, 252, 155, 137, 125, 106, 69, 55, 46, 58, 44, 62, 45, 92, 67,
 101, 50, 46, 92, 39, 34, 43, 23, 14, 42, 29, 23, 36, 49, 23, 18,
 26, 10, 26, 19, 45, 33, 36, 39, 13, 8, 5, 7, 4, 1, 1, 5, 3, 9, 3,
 4, 17, 21, 3, 10, 6, 9, 11, 3, 15, 28, 22, 18, 17, 18, 24, 22, 14,
 36, 13, 16, 24, 28, 28, 22, 29, 28, 14, 13, 3]
With the help of the matplotlib module, we can represent this
SFS graphically:
>>> from matplotlib import pyplot
>>> pyplot.stem(sfs, linefmt='k', basefmt='k')
>>> pyplot.xlabel('Absolute frequency')
>>> pyplot.ylabel('Number of sites')
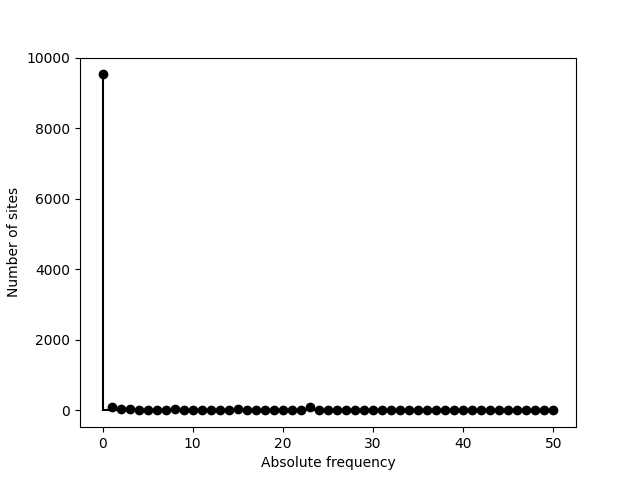
Now imagine we process a dataset with many fixed sites such as the alignment generated by this particular simulation:
>>> coalsim = egglib.coalesce.Simulator(num_pop=1, num_chrom=[100], theta=100, num_sites=10000)
>>> aln = coalsim.simul()
>>> sfs = egglib.stats.SFS(aln.iter_sites())
>>> print(sfs)
[9533, 98, 47, 32, 8, 21, 12, 13, 29, 3, 3, 3, 22, 0, 21, 41, 0, 3,
 8, 0, 1, 0, 0, 95, 1, 0, 2, 0, 0, 0, 1, 0, 0, 0, 0, 2, 0, 0, 0, 0,
 0, 0, 0, 1, 0, 0, 0, 0, 0, 0, 0]
>>> pyplot.clf()
>>> pyplot.stem(sfs, linefmt='k', basefmt='k')
>>> pyplot.xlabel('Absolute frequency')
>>> pyplot.ylabel('Number of sites')
>>> pyplot.savefig('SFS-2.png')
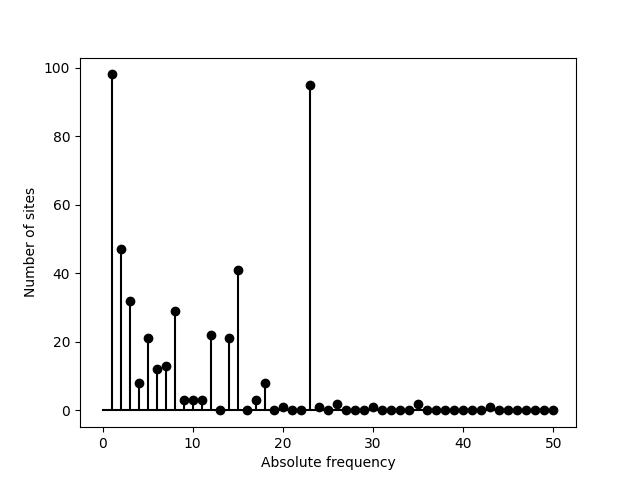
Ignoring the fixed sites can be an option. The corresponding category is
set to None (instead of being removed), avoiding a shift of indexes
of the returned list and allowing a direct plot of the result:
>>> sfs = egglib.stats.SFS(aln.iter_sites(), skip_fixed=True)
>>> print(sfs)
[None, 98, 47, 32, 8, 21, 12, 13, 29, 3, 3, 3, 22, 0, 21, 41, 0, 3,
 8, 0, 1, 0, 0, 95, 1, 0, 2, 0, 0, 0, 1, 0, 0, 0, 0, 2, 0, 0, 0, 0,
 0, 0, 0, 1, 0, 0, 0, 0, 0, 0, 0]
>>> pyplot.clf()
>>> pyplot.stem(sfs, linefmt='k', basefmt='k')
>>> pyplot.xlabel('Absolute frequency')
>>> pyplot.ylabel('Number of sites')
>>> pyplot.savefig('SFS-3.png')
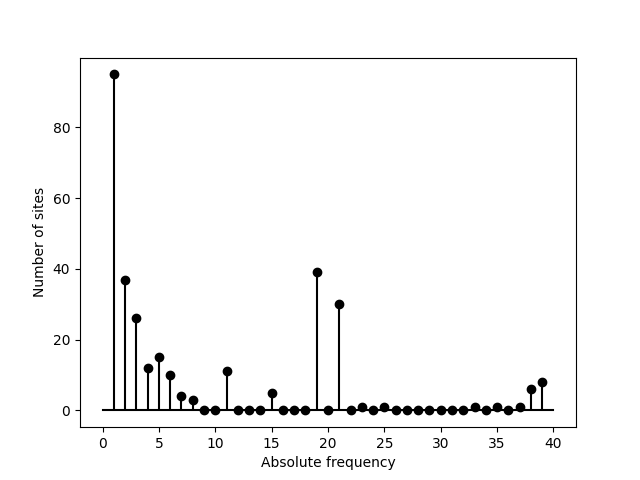
If an outgroup is available a unfolded SFS can be generated. We perform
a new simulation with a separate population with a single sample that
will be used as outgroup. Since we pass a Structure object
containing an outgroup, the unfolded SFS is compute automatically:
>>> coalsim = egglib.coalesce.Simulator(num_pop=2, num_chrom=[40, 1], theta=100, num_sites=10000)
>>> coalsim.params.add_event(T=4, cat='merge', src=0, dst=1)
>>> struct = egglib.struct_from_samplesizes([40], outgroup=1)
>>> aln = coalsim.simul()
>>> sfs = egglib.stats.SFS(aln.iter_sites(), skip_fixed=True, struct=struct)
>>> pyplot.clf()
>>> pyplot.stem(sfs, linefmt='k', basefmt='k')
>>> pyplot.xlabel('Absolute frequency')
>>> pyplot.ylabel('Number of sites')
>>> pyplot.savefig('SFS-4.png')
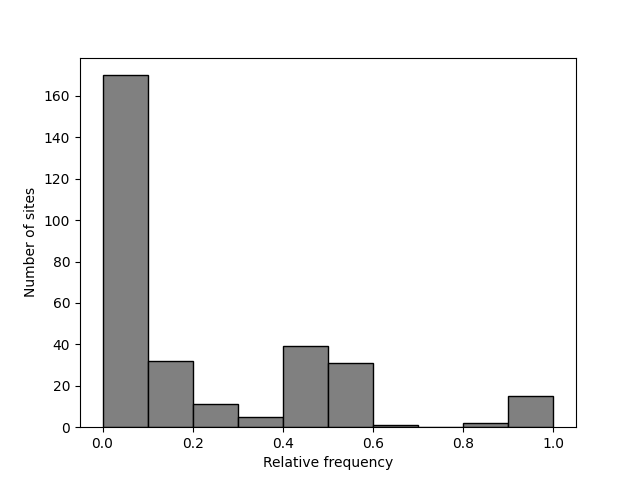
A binarized SFS can also be generated. The return value is then a list of tuples containing the upper bound and the count value. Binarized SFS might be better displayed as a bar plot so we use the bounds from the returned list to place the bars and set the width of the bars to the bin size (using a negative value for because we need to provide the position of left corner of the bars and we have the upper bounds):
>>> sfs = egglib.stats.SFS(aln.iter_sites(), skip_fixed=True, struct=struct, nbins=10)
>>> print(sfs)
[(0.1, 170), (0.2, 32), (0.3, 11), (0.4, 5), (0.5, 39), (0.6, 31),
 (0.7, 1), (0.8, 0), (0.9, 2), (1.0, 15)]
>>> pyplot.clf()
>>> x, y = zip(*sfs)
>>> pyplot.bar(x=x, height=y, width=-0.1, align='edge', color='0.5', edgecolor='k')
>>> pyplot.xlabel('Relative frequency')
>>> pyplot.ylabel('Number of sites')
>>> pyplot.savefig('SFS-5.png')
Stand-alone allelic frequencies
It can happen that only allelic frequencies are available (such as with
bulk sequencing). In that case Site is not appropriate because
it requires an ordering of samples. It would be possible to arbitrarily
create a site from a set of allelic frequencies but this would be a
pointless waste of computing resources. There is a class in EggLib, named
Freq, addressing this case.
There is a logical relationship between the classes Align,
Site, and Freq: the latter two can be created based on
instances of the respective previous one, but they can also be provided by
external means. In other words, Align and even Site can
be bypassed if the corresponding data are not available. We have seen in the
previous section that it is not necessary to artifically create an
Align instance if only available sites are available. Likewise,
Site can be bypassed if only frequencies are available.
Like Site, Freq instances can be created from different types
of source: from a Site instance, from a user-specified list, or from VCF data.
Generator functions |
Source of data |
|---|---|
A |
|
A user-provided |
|
The current data of a VCF parser (see Using VCF files). |
There are also equivalent methods to recycle an existing instance.
Creation of Freq instances from a site
If we go back to the example site created above, we see that creating a
Freq instance is rather straighforward (see highlighted line below):
>>> site = egglib.site_from_list(
...     ['C', 'G', 'G', 'C', 'T', 'T', 'G', 'T', 'G', 'G', 'G', 'G'],
...     alphabet=egglib.alphabets.DNA)
>>> freq = egglib.freq_from_site(site)
>>> for i in range(freq.num_alleles):
...     print(freq.allele(i), freq.freq_allele(i))
C 2
G 7
T 3
Creation of Freq instances from user-provided frequency data
To create a Freq instance from already computed allelic frequencies,
the syntax is logical but the data format must be followed carefully.
Here, it is necessary to provide allelic or genotypic frequencies while taking into account
population structure.
Formally, freq_from_list() expects allelic population frequencies for
an arbitrary number of clusters (at least one). The number of alleles, of
clusters, and of populations per clusters are deduced from provided data.
In practice, this requires that you provide a nested list of frequencies with
three levels: clusters, populations, individuals.
- The basic structure of the input nested list is:
First level:
[cluster1, cluster2, ...]Second level:
cluster1 = [pop1, pop2, ...]Third level:
pop1 = [p1, p2, ...]wherep1is the absolute frequency of the first allele (the number of allele must match over all populations.
In many cases, there will be no clusters, which is actually equivalent to
a single cluster. In this case, the first level would be a list containing
a single item: [[pop1, pop2, ...]].
It is possible also that there is no population structure. Then this level can be also bypassed by using a single-item list.
The outgroup is loaded as the second argument, and is provided as another list that is analogous to an additional population (a list of frequencies of all alleles, even if there is only one sample).
Actually, for simple cases, the syntax is not verbose. The above example, assuming a single cluster and a single population, while providing allelic frequencies only, writes as follows:
>>> freq = egglib.freq_from_list([[[3, 3, 2, 1, 1]]], [1, 0, 0, 0, 0])
If your data are based on genotypes, you can provide genotypic frequencies. In this case you are required to provided as well a list detailing the allele composition of each genotypes considered. In the example above, there are also five genotypes, but each is represented by a single copy. We need to recode them, and use the geno_list option:
>>> freq = egglib.freq_from_list([[[1, 1, 1, 1, 1]]], [1, 0, 0, 0, 0],
...         geno_list=[(0, 0), (0, 1), (2, 2), (3, 1), (1, 4)],
...         alphabet=egglib.alphabets.positive_infinite)
The allelic frequencies are computed automatically based on the composition of genotypes as provided.
Computing diversity statistics
Using the same example as above, we can see that we can also compute
diversity statistics for a single site or from an array of sites when
only frequencies are available (obviously, statistics requiring
haplotypic information will not be available). For this we need to use
the method process_freq() of ComputeStats:
>>> cs.clear_stats()
>>> cs.add_stats('Aing', 'He', 'R')
>>> site = egglib.site_from_align(aln1, 66)
>>> freq = egglib.freq_from_site(site)
>>> print(cs.process_freq(freq))
{'He': 0.6178217821782178, 'Aing': 3, 'R': 0.02}
>>> cs.add_stats('D', 'Pi')
>>> cs.configure(multi=True)
>>> cs.set_structure(struct)
>>> site = egglib.Site()
>>> freq = egglib.Freq()
>>> for i in range(aln1.ls):
...     site.from_align(aln1,i)
...     freq.from_site(site)
...     cs.process_freq(freq)
>>> print(cs.results())
{'Aing': 1.1378886155222545, 'Pi': 193.00524876495805, 'He': 0.023322406154947233, 'D': -0.4440572753610234, 'R': 0.0013951963115034285}